
.
For the last decade-plus, a lack of both automation and new general-purpose technologies (GPTs) have weighed on U.S. economic growth. But new research suggests that artificial intelligence (AI) will prove to be the next GPT, powering above-trend growth. Our forthcoming Megatrends research paper, due for release in June, discusses the importance of GPTs in driving periods of above-trend growth over the last 130-plus years.
“If the AI impact approaches that of electricity, our base case is that [productivity] growth will offset demographic pressures, producing an economic and financial future that exceeds consensus expectations,” said Joe Davis, global chief economist and the lead researcher.
The new research harnesses a uniquely long and rich dataset that captures historical shifts in megatrends that have driven about 60% of the change in per capita GDP growth. It finds that, among megatrends that also include demographics, fiscal deficits, and globalisation, only technology has been a consistent, powerful driver of not only growth but also the Federal Reserve’s nominal target for short-term interest rates, inflation, and stock market valuations.
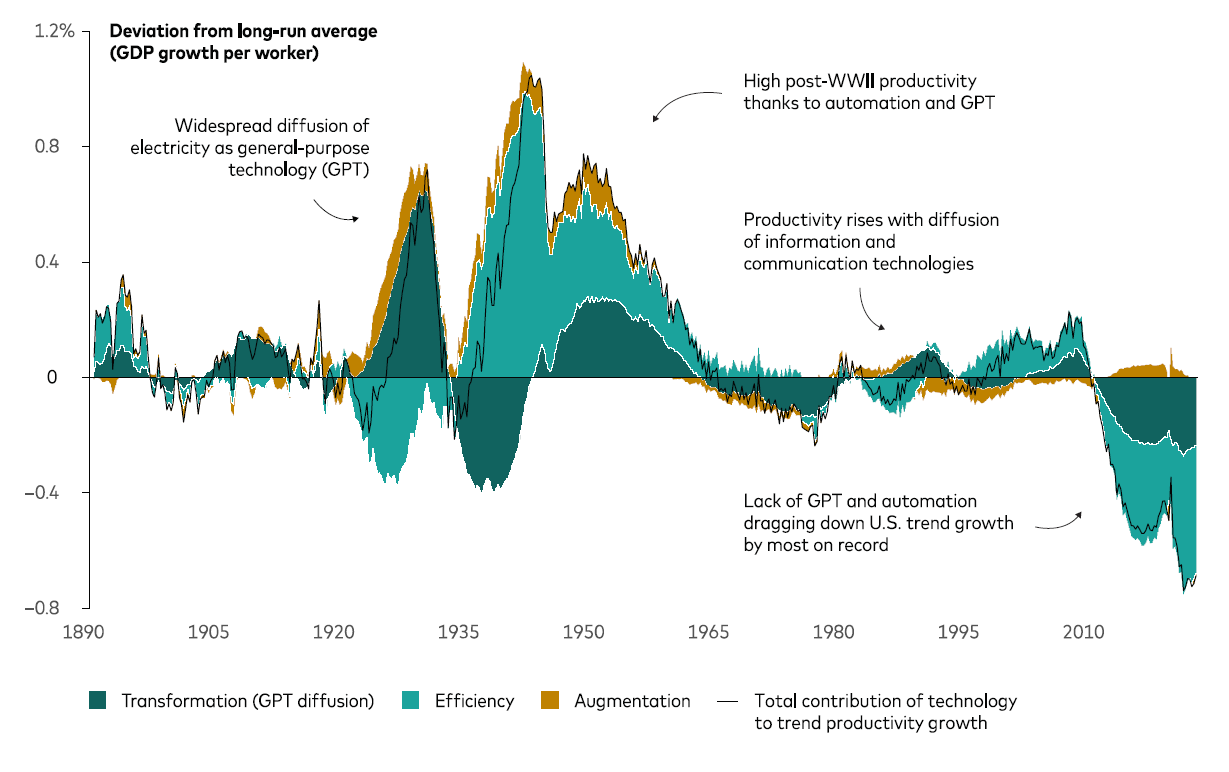
Notes: The chart breaks down three drivers of technology: augmentation, efficiency, and transformation. Augmentation refers to technological advances where humans benefit from machines, such as personal computers and power tools, raising productivity and trend employment. Efficiency refers to advances that raise GDP per worker, usually by automating away tasks previously performed by human labour. Transformation refers to GPTs that (eventually) unleash creative destruction through the economy. Our forthcoming research quantifies the prospects of AI transforming the economy in the years ahead.
Source: calculations, as of May 2024.
Outlook for financial markets
Our 10-year annualised nominal return and volatility forecasts are shown below. They are based on the 31 March, 2024, running of the Capital Markets Model® (VCMM). Equity returns reflect a range of 2 percentage points around the 50th percentile of the distribution of probable outcomes. Fixed income returns reflect a 1-point range around the 50th percentile. More extreme returns are possible.
Australian dollar investors
- Australian equities: 4.3%–6.3% (21.8% median volatility)
- Global equities ex-Australia (unhedged): 4.1%–6.1% (19.1%)
- Australian aggregate bonds: 3.7%–4.7% (5.6%)
- Global bonds ex-Australia (hedged): 4.0%–5.0% (4.9%)
Notes: These probabilistic return assumptions depend on current market conditions and, as such, may change over time.
Source: Investment Strategy Group.
IMPORTANT: The projections or other information generated by the Capital Markets Model regarding the likelihood of various investment outcomes are hypothetical in nature, do not reflect actual investment results, and are not guarantees of future results. Distribution of return outcomes from the VCMM are derived from 10,000 simulations for each modelled asset class. Simulations are as of 31 March, 2024. Results from the model may vary with each use and over time.
Region-by-region outlook
The views below are those of the global economics and markets team of Investment Strategy Group as of 15 May, 2024.
Australia
Sticky inflation continued in the first quarter, a development that the Reserve Bank of Australia (RBA) underscored in its 7 May monetary policy announcement. The RBA left its cash rate target unchanged at 4.35%, a more than 12-year-high level that has been in place for more than six months.
- We forecast that core inflation will fall to 3% on a year-over-year basis by year-end, still above the midpoint of the RBA’s 2%–3% target range. We foresee the RBA being one of the last central banks in developed markets to cut rates, doing so only in 2025.
- We expect the unemployment rate to rise to around 4.6% by year-end, as financial conditions tighten in an environment of elevated interest rates. It was 3.8% in March.
- Productivity has been slow to pick up, contributing to unit labour costs growing at a rate above what would be consistent with the RBA’s 2%–3% inflation target and prolonging the RBA’s path to eventual monetary policy easing.
- We continue to expect that Australia will avoid recession in 2024, with below-trend economic growth around 1%. GDP grew by 1.5% for all of 2023. Australia’s economy was last in recession in 1991.
United States
Inflation isn’t yet on a sustainable path toward the Federal Reserve’s 2% target. The headline Consumer Price Index rose 3.4% year over year and 0.3% month over month in April. Core inflation, which excludes volatile food and energy prices, remained elevated, at 3.6% year over year and 0.3% month over month.
- Another closely watched indicator, retail sales volumes, changed little in April compared with March. The pace of sales matters, and watch this indicator closely. But we continue to believe the U.S. consumer remains resilient and will be a catalyst for growth.
- On top of a greater-than-expected rise in producer prices (0.5% month over month) in April, the data underscore our view that the Fed won’t likely be in position to cut its monetary policy interest rate target (currently, 5.25%–5.5%) this year.
- We recently increased our forecast for 2024 core Personal Consumption Expenditures (PCE) price index inflation from 2.6% to 2.9%. The PCE is the Fed’s preferred inflation measure to guide policymaking.
- We continue to foresee full-year 2024 economic growth slightly above trend around 2%.
Canada
Will the Bank of Canada (BOC) begin a rate-cutting cycle next month? The Consumer Price Index (CPI) for April, which Statistics Canada released on 21 May, could be key. We expect the BOC to cut its overnight rate target by 25 basis points on 5 June, but a rate cut could be in jeopardy if the pace of inflation rises for a second consecutive month.
- As in the U.S., the “last mile” of inflation reduction could be the most challenging. We continue to foresee the year-over-year pace of core inflation falling by year-end into the BOC’s target range of 2%–2.5%. Shelter prices, up 6.5% year over year in March, remain an upside risk amid immigration-fuelled population growth.
- We foresee the BOC trimming its overnight policy rate by 50 to 75 basis points this year, to a year-end range of 4.25%–4.5%. (A basis point is one-hundredth of a percentage point.)
- We recently increased our forecast of 2024 economic growth from about 1% to a range of 1.25%–1.5%. Still, restrictive monetary policy skews risks to the downside.
- We forecast a year-end unemployment rate of 6%–6.5% amid weak economic growth. It held steady at 6.1% in April.
Euro area
Stronger growth momentum, higher energy prices, and a more hawkish outlook for the U.S. Federal Reserve have led us to raise our outlook for the European Central Bank (ECB) deposit facility rate at year-end. We’ve also increased our forecasts for full-year GDP growth and core inflation.
- We foresee three ECB quarter-point rate cuts this year, down from our previous outlook for five such cuts. That would leave the key monetary policy rate at 3.25% at year-end. We continue to anticipate the first rate cut occurring at the ECB’s 6 June meeting.
- We have nudged up our year-end 2024 core inflation forecast to 2.2% from 2.1%.
- We’ve increased our outlook for full-year economic growth to 0.8% from 0.6%.
- Unemployment remained steady at 6.5%, a record low, in March and likely will end 2024 around that level. However, we believe the labour market is softer than unemployment would suggest, as job vacancy rates have receded, labour hoarding remains elevated, and the number of hours worked has stagnated.
United Kingdom
Recent signals point to an uptick in economic activity and a firming of inflation persistence, leading to an increase its outlook for 2024 GDP growth, from 0.3% to 0.7%, and its outlook for year-end core inflation, from 2.6% to 2.8%.
- We continue to believe the Bank of England (BOE) will cut interest rates in August, but amid more hawkish global monetary policy developments we have dialled down our expectations for the depth of cuts this year. We anticipate a quarterly cadence of monetary policy easing, translating to two cuts in 2024 and four in 2025. That would bring the bank rate to 4.75% by year-end and 3.75% by year-end 2025.
- Our higher full-year GDP forecast reflects a first-quarter recovery, which occurred amid gradually rising real incomes, loosening financial conditions, and improved activity in the euro area. However, we expect full-year 2024 growth to be below trend due to headwinds from still-contractionary monetary and fiscal policy.
- As in the euro area, the labour market’s gradual loosening appears mainly driven by soft factors such as reduced vacancies and fewer hours worked, rather than an increase in unemployment. We foresee a year-end 2024 unemployment rate in a range of 4%–4.5%.
China
After a strong start to the year and with a four-month deflationary period apparently behind it, China’s economy seems on its way to 2024 GDP growth of “around 5%,” the target set at a Politburo meeting two months ago. However, given continued pressure on the property sector and weak consumer confidence, we remain cautious about the sustainability of growth momentum.
- Especially weak credit data make China’s economic challenges hard to ignore. Total social financing, the broadest indicator of China’s aggregate credit demand—including government bonds, bank loans, and even the shadow banking system—declined by 200 billion yuan (US$28 billion) in April, the first negative reading since the indicator was first tracked in 2002. For the first four months of the year, total social financing is down by nearly 20% year over year.
- As part of efforts to stimulate the economy, the government on 17 May held the first sales of what is expected to be a 1 trillion yuan (US$138 billion) issuance of special long-term treasury bonds. Similar bonds were issued during the 1997 Asian financial crisis, the 2008 global financial crisis, and the 2020 onset of COVID-19. The risk for structural imbalances remains, given policy priorities for investment and manufacturing upgrades over more direct measures to support consumer spending.
- We foresee full-year core inflation around 1% and full-year headline inflation of 0.8%—well below the 3% inflation target set by the People’s Bank of China (PBOC).
- To support the economy and given low levels of inflation, we expect the PBOC to ease its policy rate from 2.5% to 2.2% in 2024 and to cut banks’ reserve requirement ratios. However, we expect any easing in the near-term to be marginal. The Fed’s policy pause may limit room for the PBOC to ease meaningfully.
Emerging markets
Sticky inflation and the path of U.S. policy rates have the attention of central bankers in Latin America’s leading economies. On May 8, Brazil’s central bank cut its key interest rate to 10.5%. Though a smaller cut than it had signalled at its previous policy meeting, it was the bank’s seventh consecutive rate reduction. One day later, Mexico’s central bank held rates steady, having initiated its first cut of the policy cycle a meeting earlier.
- While Banco de México (Banxico) maintained its 11% target for the overnight interbank rate, we have raised our outlook for Banxico’s year-end policy rate by 50 basis points to a range of 9.5%-10%, suggesting cuts of 100 to 150 basis points over the remainder of 2024. (A basis point is one-hundredth of a percentage point.)
- We’ve also modestly increased our forecast for year-end core inflation in Mexico to 3.7%–3.9%, largely in line with Banxico’s view.
- Amid continued strength in the U.S. economy, we recently upgraded our forecast of GDP growth in Mexico. U.S. demand for Mexican goods has remained strong, and domestic wages and consumption are holding up. We expect below-trend 2024 GDP growth of 1.75%–2.25%.
- We continue to forecast about 4% average 2024 GDP growth for emerging markets worldwide, led by growth of about 5% for emerging Asia. We anticipate growth of 2%–2.5% for emerging Europe and Latin America, though U.S. growth could have positive implications for Mexico and all of Latin America.
IMPORTANT: The projections and other information generated by the Capital Markets Model® regarding the likelihood of various investment outcomes are hypothetical in nature, do not reflect actual investment results, and are not guarantees of future results. VCMM results will vary with each use and over time.
The VCMM projections are based on a statistical analysis of historical data. Future returns may behave differently from the historical patterns captured in the VCMM. More important, the VCMM may be underestimating extreme negative scenarios unobserved in the historical period on which the model estimation is based.
The Capital Markets Model is a proprietary financial simulation tool developed and maintained by Vanguard’s primary investment research and advice teams. The model forecasts distributions of future returns for a wide array of broad asset classes. Those asset classes include U.S. and international equity markets, several maturities of the U.S. Treasury and corporate fixed income markets, international fixed income markets, U.S. money markets, commodities, and certain alternative investment strategies. The theoretical and empirical foundation for the Vanguard Capital Markets Model is that the returns of various asset classes reflect the compensation investors require for bearing different types of systematic risk (beta). At the core of the model are estimates of the dynamic statistical relationship between risk factors and asset returns, obtained from statistical analysis based on available monthly financial and economic data from as early as 1960. Using a system of estimated equations, the model then applies a Monte Carlo simulation method to project the estimated interrelationships among risk factors and asset classes as well as uncertainty and randomness over time. The model generates a large set of simulated outcomes for each asset class over several time horizons. Forecasts are obtained by computing measures of central tendency in these simulations. Results produced by the tool will vary with each use and over time.
This article contains certain 'forward looking' statements. Forward looking statements, opinions and estimates provided in this article are based on assumptions and contingencies which are subject to change without notice, as are statements about market and industry trends, which are based on interpretations of current market conditions. Forward-looking statements including projections, indications or guidance on future earnings or financial position and estimates are provided as a general guide only and should not be relied upon as an indication or guarantee of future performance. There can be no assurance that actual outcomes will not differ materially from these statements. To the full extent permitted by law, Vanguard Investments Australia Ltd (ABN 72 072 881 086 AFSL 227263) and its directors, officers, employees, advisers, agents and intermediaries disclaim any obligation or undertaking to release any updates or revisions to the information to reflect any change in expectations or assumptions.
© 2024 Vanguard Investments Australia Ltd. All rights reserved.
Vanguard
May 2024
vanguard.com.au
27th-June-2024 |
